Performance API简洁及使用
Performance API简介
Performance API是什么?
衡量和分析各种性能指标对于确保 web 应用的速度非常重要。Performance API 提供了重要的内置指标,并能够将你自己的测量结果添加到浏览器的性能时间线(performance timeline)中。性能时间线使用高精度的时间戳,且可以在开发者工具中显示。你还可以将相关数据发送到用于分析的端点,以根据时间记录性能指标。
Performance API的作用和优势
1. 提供详细的性能信息:Performance API不仅提供了页面加载时间等基本信息,还提供了更详细的性能数据,如各个阶段的开始和结束时间、资源加载时间、事件处理时间等。这些详细信息可以帮助开发者更准确地分析和定位性能问题。
2. 支持多种性能指标:Performance API支持多种常用的性能指标,如页面加载时间、资源加载时间、重定向次数、DNS解析耗时等。这些指标可以帮助开发者全面评估网页的性能,并进行有针对性的优化。
3. 可以与其他API集成:Performance API可以与其他API集成使用,如Navigation Timing API、Resource Timing API等。通过结合使用不同的API,开发者可以获取更全面和准确的性能数据,并进行更深入的分析和优化。
4. 提升用户体验:通过使用Performance API来优化网页性能,可以提升用户的体验。快速加载的网页可以减少用户等待时间,流畅的交互性能可以提高用户的操作体验,从而增加用户的满意度和留存率。
window.performance
performance.timing字段介绍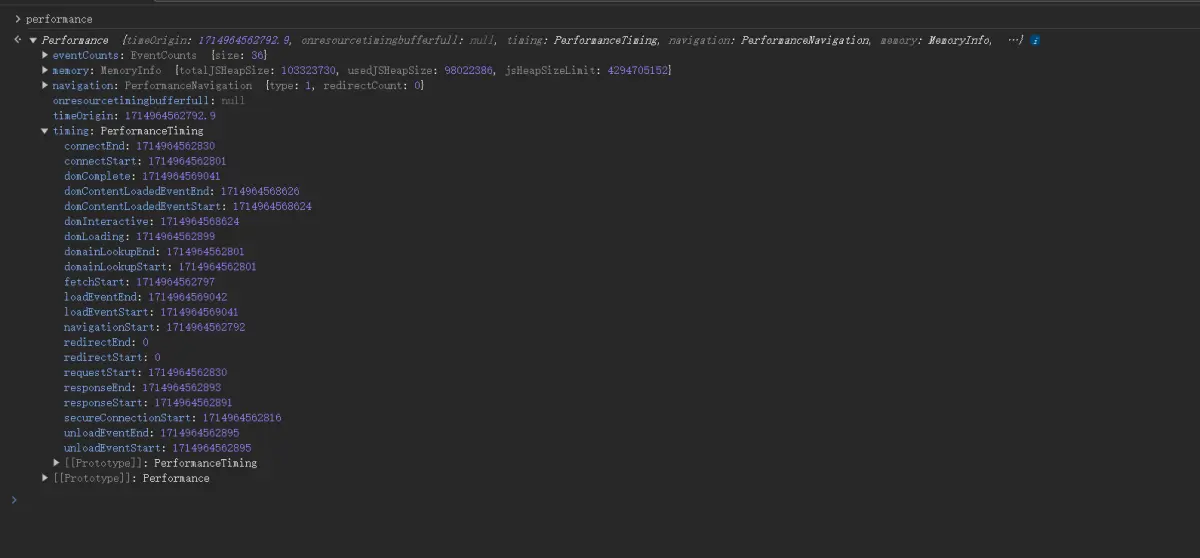
| navigationStart | 初始化页面,在同一个浏览器上下文中前一个页面unload的时间戳,如果没有前一个页面的unload,则与fetchStart值相等 |
|---|---|
| redirectStart | 第一个HTTP重定向发生的时间,有跳转且是同域的重定向,否则为0 |
| redirectEnd | 最后一个重定向完成时的时间,否则为0 |
| fetchStart | 浏览器准备好使用http请求获取文档的时间,这发生在检查缓存之前 |
| domainLookupStart | DNS域名开始查询的时间,如果有本地的缓存或keep-alive则时间为0 |
| domainLookupEnd | DNS域名结束查询的时间 |
| connectStart | TCP开始建立连接的时间,如果是持久连接,则与fetchStart值相等 |
| secureConnectionStart | https 连接开始的时间,如果不是安全连接则为0 |
| connectEnd | TCP完成握手的时间,如果是持久连接则与fetchStart值相等 |
| requestStart | HTTP请求读取真实文档开始的时间,包括从本地缓存读取 |
| requestEnd | HTTP请求读取真实文档结束的时间,包括从本地缓存读取 |
| responseStart | 返回浏览器从服务器收到(或从本地缓存读取)第一个字节时的Unix毫秒时间戳 |
| responseEnd | 返回浏览器从服务器收到(或从本地缓存读取,或从本地资源读取)最后一个字节时的Unix毫秒时间戳 |
| unloadEventStart | 前一个页面的unload的时间戳 如果没有则为0 |
| unloadEventEnd | 与unloadEventStart相对应,返回的是unload函数执行完成的时间戳 |
| domLoading | 返回当前网页DOM结构开始解析时的时间戳,此时document.readyState变成loading,并将抛出readyStateChange事件 |
| domInteractive | 返回当前网页DOM结构结束解析、开始加载内嵌资源时时间戳,document.readyState 变成interactive,并将抛出readyStateChange事件(注意只是DOM树解析完成,这时候并没有开始加载网页内的资源) |
| domContentLoadedEventStart | 网页domContentLoaded事件发生的时间 |
| domContentLoadedEventEnd | 网页domContentLoaded事件脚本执行完毕的时间,domReady的时间 |
| domComplete | DOM树解析完成,且资源也准备就绪的时间,document.readyState变成complete.并将抛出readystatechange事件 |
| loadEventStart | load 事件发送给文档,也即load回调函数开始执行的时间 |
| loadEventEnd | load回调函数执行完成的时间 |
1. Performance接口`
- 获取页面加载时间
- 获取页面资源加载时间
使用示例:
`// 获取页面加载时间
const loadTime = window.performance.timing.loadEventEnd - window.performance.timing.navigationStart;
console.log('页面加载时间:', loadTime);

// 获取资源加载时间
const resources = window.performance.getEntriesByType('resource');
resources.forEach(resource => {
 console.log('资源URL:', resource.name);
 console.log('资源加载时间:', resource.duration);
});
2. PerformanceTiming接口`
PerformanceTiming接口提供了更详细的页面加载时间信息,包括各个阶段的开始和结束时间。它是Performance API中用于测量页面性能的重要接口。
- 获取重定向耗时
- 获取DNS解析耗时
- 获取TCP连接耗时
使用示例:
const timing = window.performance.timing;
const redirectTime = timing.redirectEnd - timing.redirectStart;
const dnsTime = timing.domainLookupEnd - timing.domainLookupStart;
const tcpTime = timing.connectEnd - timing.connectStart;

console.log('重定向耗时:', redirectTime);
console.log('DNS解析耗时:', dnsTime);
console.log('TCP连接耗时:', tcpTime);`
3. PerformanceNavigation接口`
PerformanceNavigation接口提供了有关页面导航的信息,如重定向次数、是否通过缓存加载等。它可以帮助开发者了解页面导航过程中的性能指标。
使用示例:
const navigation = window.performance.navigation;
console.log('重定向次数:', navigation.redirectCount);
console.log('是否通过缓存加载:', navigation.type === 1 ? '是' : '否');
4. PerformanceEntry接口`
PerformanceEntry接口提供了有关特定资源或事件的详细性能信息,如资源加载时间、事件处理时间等。它可以用于监控和分析特定资源或事件的性能。
使用示例:
// 监控资源加载性能
window.performance.getEntriesByType('resource').forEach(entry => {
 console.log('资源URL:', entry.name);
 console.log('资源加载时间:', entry.duration);
 console.log('资源大小:', entry.transferSize);
});

// 监控事件处理性能
window.performance.getEntriesByType('event').forEach(entry => {
 console.log('事件类型:', entry.name);
 console.log('事件处理时间:', entry.duration);
});
这些示例展示了Performance API中各个接口的基本用法,开发者可以根据具体需求使用不同的接口来获取更详细和准确的性能信息,并进行相应的优化和分析。
实际应用场景
1. 如何利用Performance API优化网页加载速度
- 使用Performance API获取页面加载时间,找出加载时间较长的资源,并进行优化。
const loadTime = window.performance.timing.loadEventEnd - window.performance.timing.navigationStart;
console.log('页面加载时间:', loadTime);

const resources = window.performance.getEntriesByType('resource');
resources.forEach(resource => {
 if (resource.duration > 1000) {
 console.log('加载时间较长的资源:', resource.name);
 // 进行相应的优化,如压缩、缓存等
 }
});
- 使用Performance API监控资源加载性能,找出加载时间较长的资源,并进行优化。
window.performance.getEntriesByType('resource').forEach(entry => {
 if (entry.duration > 1000) {
 console.log('加载时间较长的资源:', entry.name);
 // 进行相应的优化,如压缩、缓存等
 }
});
2. 如何利用Performance API监控用户交互性能:
- 监控用户点击按钮的交互性能。
document.querySelector('#myButton').addEventListener('click', function(event) {
 const interactionTime = window.performance.now() - event.timeStamp;
 console.log('用户点击交互时间:', interactionTime);
});
- 监控用户滚动页面的交互性能。
document.addEventListener('scroll', function(event) {
 const interactionTime = window.performance.now() - event.timeStamp;
 console.log('用户滚动交互时间:', interactionTime);
});
通过使用Performance API,开发者可以获取页面加载时间和资源加载性能,从而找出加载时间较长的资源并进行优化。同时,通过监控用户交互性能,开发者可以了解用户与网页的交互体验,并进行相应的优化。这些实际应用场景和示例代码可以帮助开发者更好地利用Performance API来优化网页性能。
参考文章地址:https://juejin.cn/post/7291586138103038010 MDN: https://developer.mozilla.org/zh-CN/docs/Web/API/Performance_API